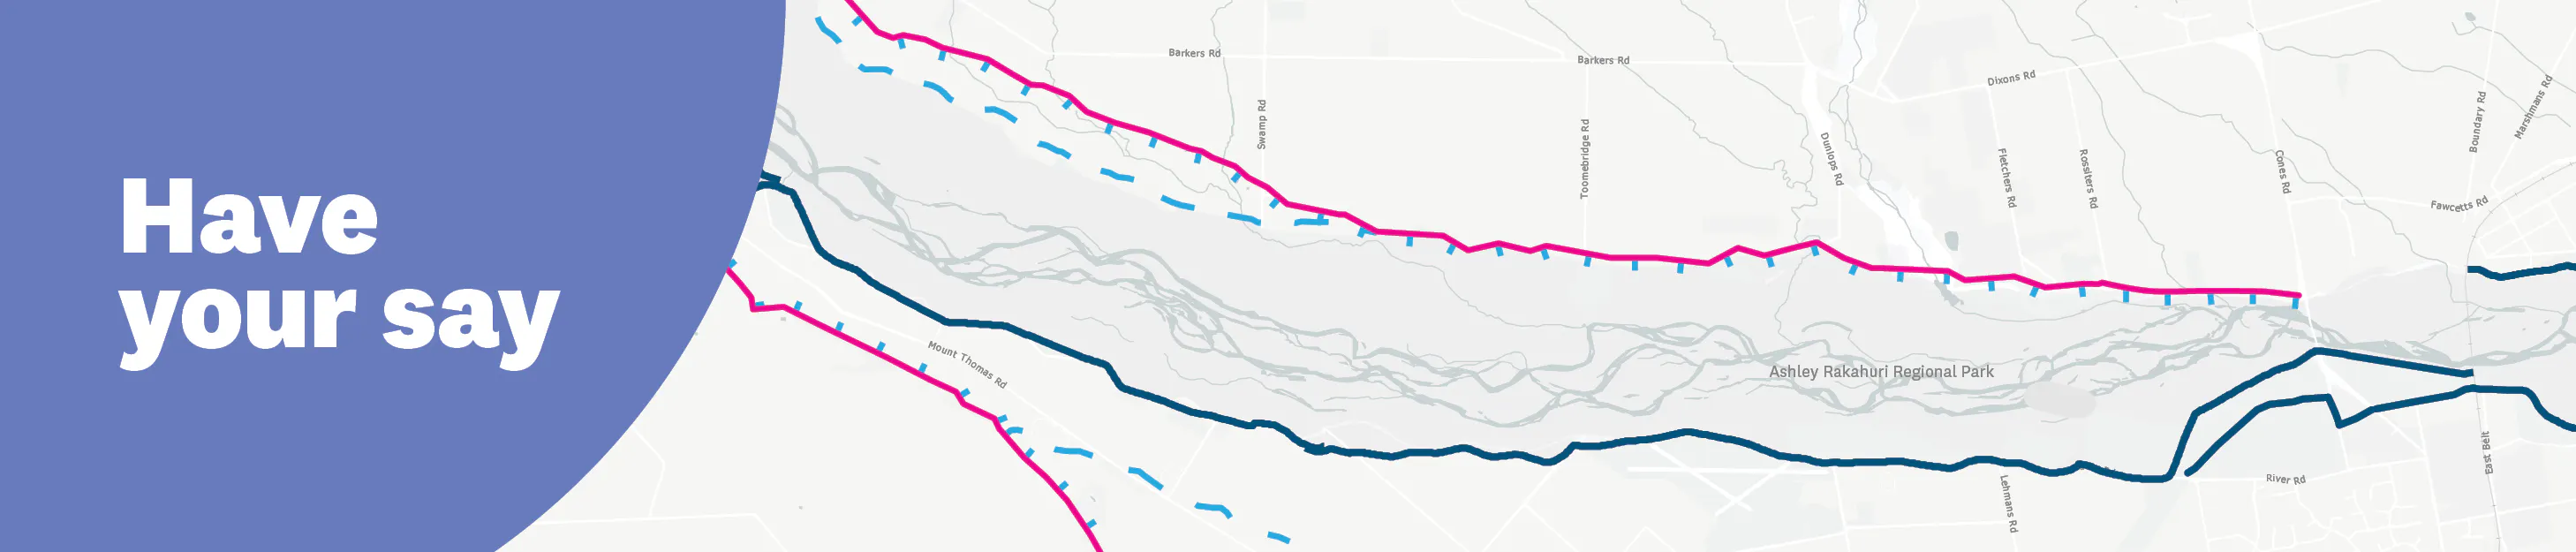
Flood modelling maps
These maps show the potential extent and depth of flooding if the Ashley Rakahuri were to breach the primary stopbank at the Ōkūkū confluence and near Smarts Road during a 1-in-500 -year flood event. The Ōkūkū confluence is one of the most likely breakout locations along the primary stopbank, but a flood could break out at any point in the stopbank, as braided rivers are highly dynamic. A breakout could also occur in a smaller flood event, such as a 1-in-100 year event, as erosion rather than overtopping is the cause of breakouts.
The coloured areas on the map indicate where floodwater could travel across the floodplain and how deep the water could become. The different colours on the map represent different estimated water depths in metres. See the colour key on the side of the map.
 Flood modelling - Upstream of Rangiora
  Flood modelling - Ōkūkū confluence to coast
 How our flood modelling is developed
We use a combination of the following:
Historic breakout data
Updated LiDAR ground levels (remote sensing technology that uses laser lights to determine ground levels)
Recent hydrology and climate information
Different flow scenarios, including rare but high-impact events
Sensitivity testing to understand how water behaves when it breaches stopbanks
Models are peer reviewed internally and will continue to be refined using information from site visits, landowner feedback, and iwi knowledge. The depth ranges shown in the key are estimates based on modelling, not precise measurements at individual properties.

Thank you for your contribution!
Help us reach out to more people in the community
Share this with family and friends